Use the data in the table to make a line graph showing the average acreage (in acres) of U.S. farms for the years 1950 through 1990.
?
YearNumber of U.S. farms (in millions)Average size of U.S. farms (acres)19505.621419604.033019702.939919802.444119902.147820002.2439?
A. 
B. 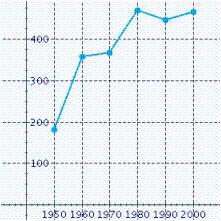
C. 
D. 
E. 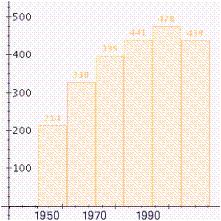
Answer: C
Mathematics
You might also like to view...
Find the equilibrium solutions of the equation of change 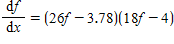 . Round your answer to two decimal places, if necessary.
?
. Round your answer to two decimal places, if necessary.
?
A.  and
and 
B.  and
and 
C.  and
and 
D.  and
and 
Mathematics
Replace A with the proper expression such that the fractions are equivalent. =
= 
A. 2x2 + 2x B. x2 + 4x + 4 C. x2 + 4 D. 2x2 + 4x
Mathematics
Multiply and simplify. ? 3b
? 3b
A.  b
b
B. 
C. 
D. 11b
Mathematics
Identify the type of graph. = 1 +
= 1 + 
A. The graph is an ellipse with foci on the y-axis. B. The graph is a hyperbola that opens to the right and left. C. The graph is a hyperbola that opens upward and downward. D. The graph is an ellipse with foci on the x-axis.
Mathematics