In the figure above, the demand is elastic in the range of prices between
A) $3.50 and $4.50 per cup
B) $2.50 and $3.50 per cup
C) $1.00 and $2.00 per cup
D) $2.00 and $4.00 per cup
E) $1.75 and $2.75 per cup
A
You might also like to view...
Use the figure below to answer the following question.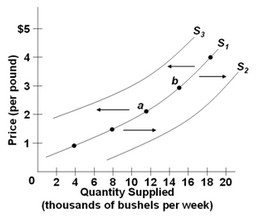 The diagram shows three supply curves for wheat. Which of the following would cause the supply of wheat to shift from S1 to S3?
A. a decrease in the price of wheat B. an increase in the cost of maintaining the equipment used in wheat farming C. an increase in the number of acres of farmland allocated to wheat D. a decrease in the cost of maintaining the equipment used in wheat farming
Explain why the price elasticity of demand varies along a demand curve, even if the demand curve is linear
What will be an ideal response?
Who among the following individuals is not an underemployed or a discouraged worker?
a. A person employed part-time but willing to work full-time b. A homeless person who has not found work for a year and has given up looking for jobs c. A nuclear physicist unable to work because of illness d. A gourmet French chef working part-time at Burger King e. A 60-year-old professor who has stopped looking for a teaching job because schools consider him too old
Explain the different dimensions of technological progress
What will be an ideal response?