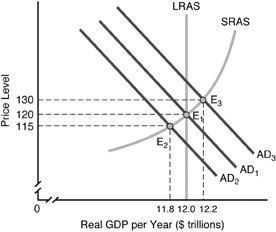
 Consider the above figure. If the aggregate demand curve rose from AD1 to AD3, our nation would be experiencing
A. falling prices.
B. a recessionary gap.
C. unemployment.
D. an inflationary gap.
Answer: D
You might also like to view...
In the figure above, the SLF curve is the supply of loanable funds curve and the PSLF curve is the private supply of loanable funds curve. If there is no Ricardo-Barro effect, the figure shows a situation in which the government has a budget
A) deficit of $0.2 trillion. B) deficit of $1.6 trillion. C) surplus of $1.4 trillion. D) surplus of $0.2 trillion. E) surplus of $1.8 trillion.
As we move down a particular indifference curve, if the "marginal rate of substitution" between the two goods does not change we can conclude that the two goods are:
A) perfect substitutes. B) perfect complements. C) totally unrelated. D) both inferior goods.
Kristi and Rebecca sell lemonade on the corner for $0.50 per cup. It costs them $0.10 to make each cup. On a certain day, their producer surplus is $20 . How many cups did Kristi and Rebecca sell?
a. 40. b. 200. c. 8. d. 50.
The marginal propensity to consume is equal to:
a) Total spending / total consumption b) Total consumption / total income c) Change in consumption / change in income d) Change in consumption / change in savings