Mathematically, the value of the tax multiplier in terms of the marginal propensity to consume (MPC) is given by the formula:
a. MPC ? 1.
b. (MPC ? 1) / MPC.
c. 1 / MPC.
d. 1 ? [1 / (1 ? MPC)].
d
You might also like to view...
The Friedman-Savage utility function can explain why
A) people buy automobile insurance. B) somebody becomes addicted to gambling. C) people become more risk averse as their wealth increases. D) people place small bets to have a chance at winning a large amount.
The evidence from wage data allows us to conclude that nonsupervisory workers were economically worse off in 2008 than 1975
a. This conclusion is correct because such workers have been suffering form increasing unemployment since 1975 b. This conclusion is correct because such workers have been receiving an ever-decreasing share of their income in nonwage benefits. c. This conclusion is correct because nominal wages for such workers have stayed constant since 1975. d. This conclusion is correct because nominal wages for such workers have fallen since 1975. e. This is a mistaken conclusion because the CPI overstates inflation.
Macroeconomics is the study of
a. individual decision makers. b. international trade. c. economy-wide phenomena. d. markets for large products.
The accompanying figure shows the demand curve, marginal revenue curve, marginal cost curve and average total cost curve for a monopolist.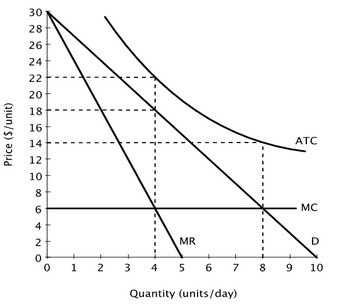 At the socially optimal level of output, this monopolist would:
A. incur an economic loss of $64. B. incur an economic loss of $112. C. earn an economic profit of $16. D. incur an economic loss of $16.