Ans: d. None of the above are correct.
Refer to Figure 1. The figure represents a circular-flow diagram. Boxes C and D represent
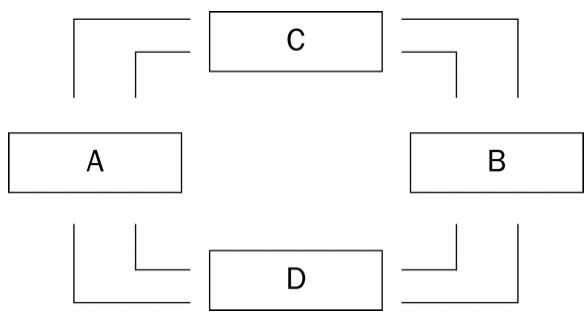
a. households and government.
b. firms and government.
c. the markets for goods and services and the financial markets.
d. None of the above are correct.
Economics
You might also like to view...
If two goods are complementary,
a. a decrease in the price of one good will lead to a decrease in the demand for the other b. the cross elasticity of demand is zero c. an increase in the price of one good will lead to an increase in the demand for the other d. the cross elasticity of demand is positive e. a decrease in the price of one good will lead to an increase in the demand for the other
Economics
During a recession:
a. Net exports tend to rise. b. Consumption tends to rise. c. Net exports remain unchanged. d. Businesses tend to invest more in new plant and equipment. e. Inventories tend to fall as businesses sell them off.
Economics
Suppose that income tax revenues are maximized at an average (income) tax rate of 45 percent. If the Laffer curve is a correct diagrammatic representation of the relationship between tax rates and tax revenue, it follows that a tax rate of
A) 35 percent will reduce tax revenues. B) 48 percent will reduce tax revenues. C) 48 percent will generate as much tax revenue as a tax rate of 45 percent. D) 35 percent will generate as much tax revenue as a tax rate of 45 percent. E) a and b
Economics
The salary of the president of the United States in 2000 was $400,000. In 1940, the president's salary was $75,000. If the Consumer Price Index was 8.1 in 1940 and 100 in 2000, the 1940 presidential salary measured in terms of the purchasing power of the dollar in 2000 would be:
A. less than $75,000. B. less than $400,000. C. approximately $668,850. D. approximately $926,000.
Economics