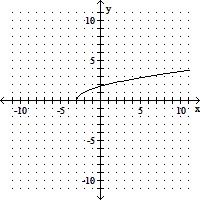
The graph of a one-to-one function f is given. Draw the graph of the inverse function f-1 as a dashed line or curve.f(x) = 
A. 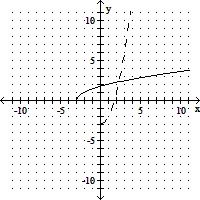
B. 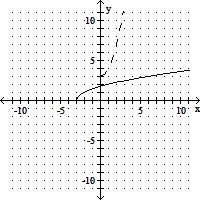
Answer: A
You might also like to view...
Graph the function by starting with the graph of the basic function and then using the techniques of shifting, compressing, stretching, and/or reflecting.f(x) =  + 3
+ 3
A. 
B. 
C. 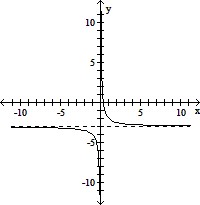
D. 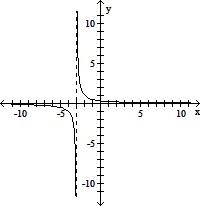
Use transformations to graph the function.y = sin x - 5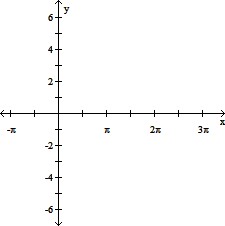
A. 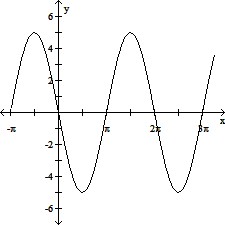
B. 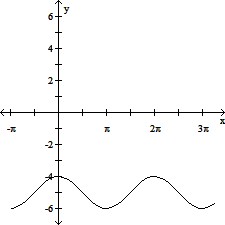
C. 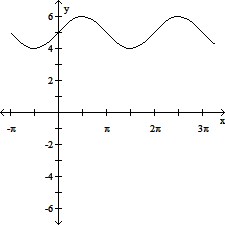
D. 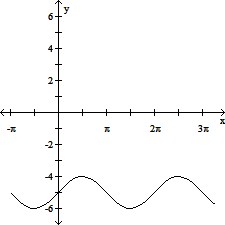
The graph below indicates the number of new cases of Chalk Dust Disease (CDD) diagnosed each month in the Mathland. Let T(t) represent the total number of new cases per month, F(t) the number of new cases per month among algebraists, G(t) the number of new cases per month among geometers, and t the number of years since January 1, 1990.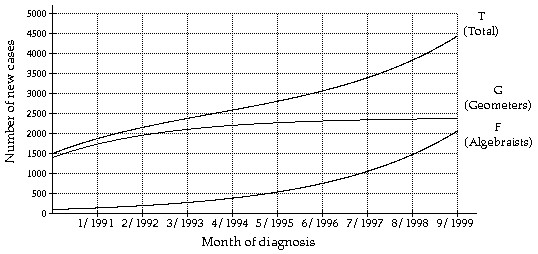 Estimate G(5) and interpret its meaning.
A. 540; In January, 1995, there were about 540 new cases of CDD diagnosed among algebraists. B. 2300; In January, 1995, there were about 2300 new cases of CDD diagnosed among geometers. C. 2800; In January, 1995, there were about 2800 new cases of CDD diagnosed. D. 2800; In January, 1995, there were about 2800 new cases of CDD diagnosed among geometers.
For problems 7 and 8 use the parabola ![]() to answer the questions. Write the equation of the directrix.
to answer the questions. Write the equation of the directrix.
A. ![]()
B. ![]()
C. ![]()
D. ![]()
E. None of these