What has been the trend in eliminating poverty since 1960?
Progress was made through the 1960s, particularly with President Johnson's "War on Poverty." The percentage of the population living in poverty was little changed in the 1970s but increased again during the 1980s. It edged down after the 1981-1982 recession but again rose during the late 1980s and early 1990s. Poverty rose again when the economy slumped early in this decade, declined somewhat in 2005 and 2006, and then increased sharply during the 2007-2009 recession.
You might also like to view...
Refer to Sales Tax. Area C + D + F + G
The following questions refer to the accompanying diagram which shows the effects of a sales tax imposed on consumers. The initial price and quantity are P0 and Q0, respectively. After the tax is imposed, the equilibrium quantity is Q1, firms receive the price Ps, and consumers pay the price Pd.
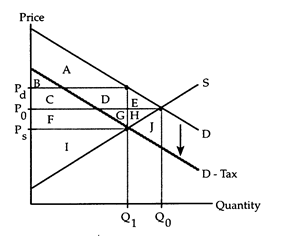
a. the total value that consumers receive from their purchases.
b. the tax revenue collected by the government.
c. the fall in producers' surplus.
d. the deadweight loss due to the tax.
The concept of "the invisible hand" suggests that markets
A) do not produce the efficient quantity. B) are always fair. C) produce the efficient quantity. D) are unfair. E) allocate resources unfairly and inefficiently.
Price elasticities of supply are always:
a. the same as price elasticities of demand. b. negative numbers. c. positive numbers. d. greater than one. e. increased when a tax is imposed.
Refer to the graph. Consider asset D. We would expect arbitrage to:
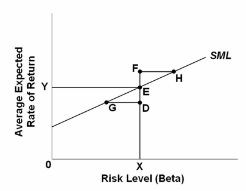
A. increase the risk level of D.
B. increase the price of D.
C. lower the price of D.
D. increase both the expected return and risk level of D.