Refer to Figure f. A benefit function is plotted in Figure f. The letter D represents the:
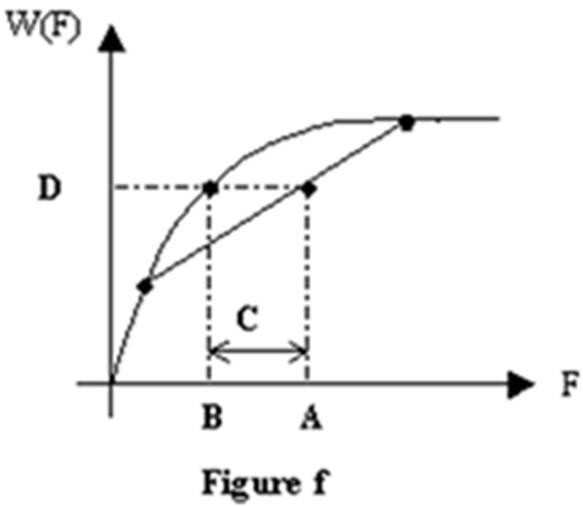
A. risk premium of the consumption bundle.
B. expected utility of the consumption bundle.
C. certainty equivalent of the consumption bundle.
D. expected consumption.
B. expected utility of the consumption bundle.
You might also like to view...
Why is the price at which the quantity demanded equals the quantity supplied the equilibrium price?
What will be an ideal response?
If the magnitude of the external costs in an industry increased
a. The supply curve including external costs would increase b. The efficient price would increase c. The market price would increase d. Both a and b are true
Refer to Figure 9.4. In the long run, how much should the firm produce at the price P3?
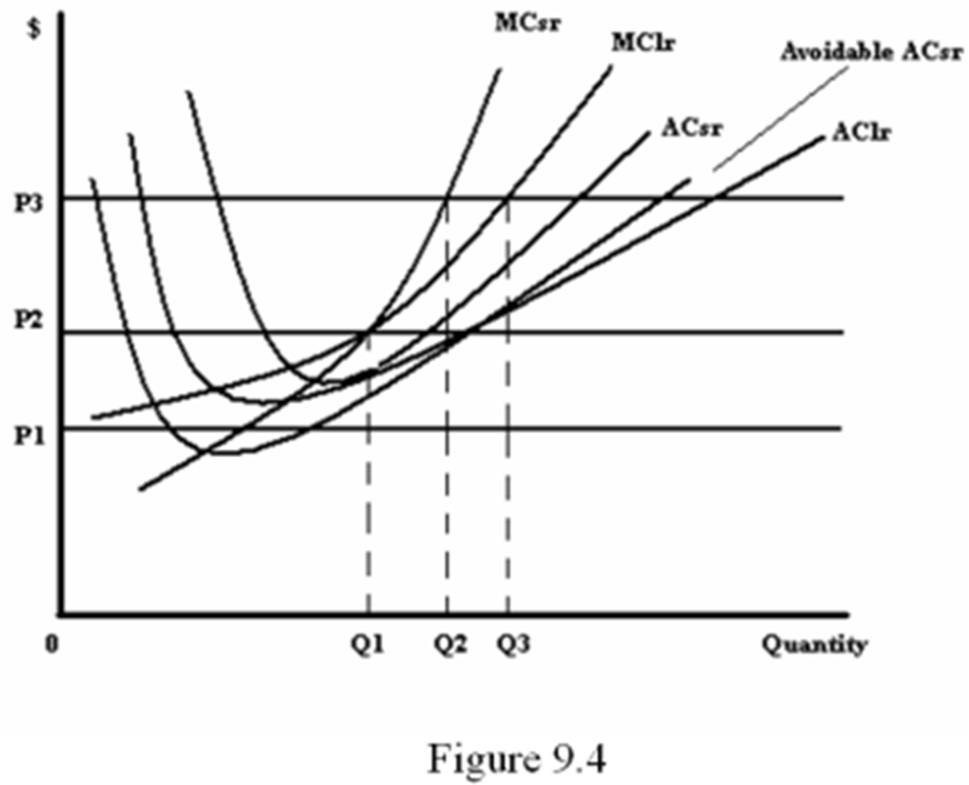
A. 0
B. Q1
C. Q2
D. Q3
During the last tax year you lent money at a nominal rate of 6 percent. Actual inflation was 1.5 percent, but people had been expecting 1 percent . This difference between actual and expected inflation
a. transferred wealth from the borrower to you and caused your after-tax real interest rate to be 0.5 percentage points higher than what you had expected. b. transferred wealth from the borrower to you and caused your after-tax real interest rate to be more than 0.5 percentage points higher than what you had expected. c. transferred wealth from you to the borrower and caused your after-tax real interest rate to be 0.5 percentage points lower than what you had expected. d. transferred wealth from you to the borrower and caused your after-tax real interest rate to be more than 0.5 percentage points lower than what you had expected.