True or False?
 FIGURE 1.png)
False
You might also like to view...
The income I, in dollars per month, for a fish farm depends on the fish population  , measured in hundreds of fish. The relationship is
 .
.
A: Make a graph of I versus n for fish populations up to 15 hundred fish.B: The expense E, in dollars per month, also depends on the population (again measured in hundreds). The relationship is
 .
.
Add the graph of E versus n to the graph you made in part A.C: The fish farm is profitable if income exceeds expenses. What range of fish population results in a profitable fish farm?
What will be an ideal response?
Solve the problem.Tides go up and down in a 12.4-hour period. The average depth of a certain river is 10 m and ranges from 5 to 15 m. The variation can be approximated by a sine curve. Write an equation that gives the approximate variation y, if x is the number of hours after midnight and high tide occurs at 5:00 am.
A. y = 5 sin  + 10
+ 10
B. y = 10 sin  + 5
+ 5
C. y = 10 sin  + 5
+ 5
D. y = 5 sin  + 10
+ 10
Complete the table. Round to the nearest whole percent, when necessary.
A. 60; 100% increase B. 156; 75% decrease C. 60; 125% increase D. 156; 175% increase
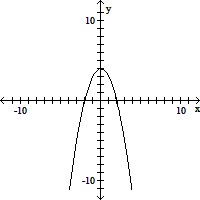
Provide an appropriate response.Sketch the graph of a quadratic function for which the solutions of f(x) = 0 are negatives of each other and the y-intercept is positive.
A. 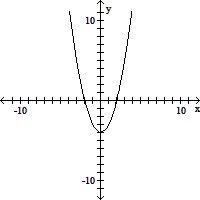
B. 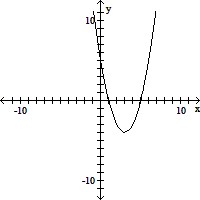
C. 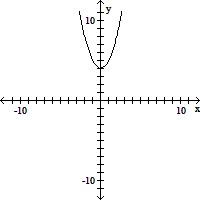
D.