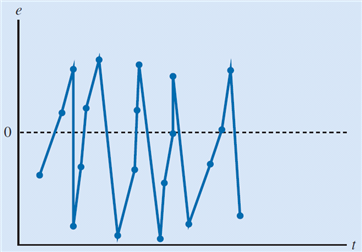
The scatter chart below displays the residuals versus the dependent variable, t. Which of the following conclusions can be drawn based upon this scatter chart?
A. model is time-invariant.
B. model captures the relationship between the variables accurately.
C. residuals are not independent.
D. residuals are normally distributed.
Answer: C
You might also like to view...
An American company makes a credit purchase of goods from a company in London for $1,000. On the date of purchase, the exchange rate was $1.50 per pound. However, on the date of payment, the rate had risen to $1.55 per pound. As a result, the American company would record
A) an exchange gain of $50. B) an exchange loss of $1,550. C) an exchange loss of $50. D) no exchange gain or loss.
A company's product development strategy
A) defines the set of customer needs that it seeks to satisfy through its products and services. B) specifies the portfolio of new products that it will try to develop. C) specifies how the market will be segmented and how the product will be positioned, priced, and promoted. D) determines the nature of procurement and transportation of materials as well as manufacture and distribution of the product.
An international soda manufacturer runs an ad campaign in which it addresses the problem of global warming. The campaign aims to educate people on the issue in depth and provides an alternative perspective on lifestyle choices. This ad is an example of
A. event marketing. B. corporate repositioning. C. image sponsorship. D. advocacy advertising. E. specialty advertising.
A series of data points on a grid that are continuously connected by straight lines that display a picture of selected data changing over a period of time is called a bar chart.?
Answer the following statement true (T) or false (F)