The Laffer curve illustrates that:
A. high tax rates could lead to lower tax revenues if economic activity is severely discouraged.
B. lowering tax rates will always increase tax revenues.
C. high tax rates would increase tax revenue and increase the labor supply as people work harder to maintain their standard of living.
D. lowering tax rates will always decrease tax revenues.
Answer: A
You might also like to view...
Based on the figure below. Starting from long-run equilibrium at point C, a tax cut that increases aggregate demand from AD to AD1 will lead to a short-run equilibrium at point ________ and eventually to a long-run equilibrium at point ________, if left to self-correcting tendencies. 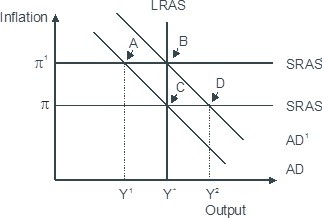
A. D; C B. B; C C. B; A D. D; B
In the closed economy IS-LM model, an increase in government spending crowds-out
a. prices. b. the money supply. c. consumption. d. investment. e. both c and d.
Using the table? above, the number of people in the labor force is
A) 165 million. B) 175 million. C) 195 million. D) 185 million. E) 145 million.
If the production of a product or service involves external or spillover benefits, then the government can improve efficiency in the market by:
A. imposing a corrective tax to correct for an overallocation of resources.
B. providing a subsidy to correct for an underallocation of resources.
C. imposing a corrective tax to correct for an underallocation of resources.
D. providing a subsidy to correct for an overallocation of resources.