Figure 8-1
?
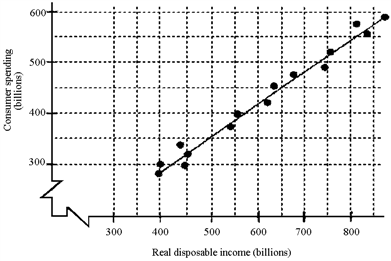
Based on the scatter diagram in Figure 8-1, approximately how much will consumption increase after a permanent tax cut of $400 billion?
A. $100 billion
B. $150 billion
C. $250 billion
D. $350 billion
Answer: C
You might also like to view...
Empirical studies find that exchange rates are much more variable than inflation differentials. How can we explain this empirical result?
What will be an ideal response?
According to employment studies, what is the most productive day of the week?
a. Monday b. Tuesday c. Wednesday d. Thursday
Even though insignificant explanatory variables can raise the adjusted R2 of a demand function, one should not interpret their effects on the regression when
a. testing marketing hypotheses about the determinants of demand b. analyzing inventory relative to capacity requirements c. forecasting unit sales for operations planning d. sales revenue reaches its peak e. planning for capital budgets
Considering the foreign exchange market, specifically the market for U.S. dollars and British pounds, who is supplying dollars in this market?
What will be an ideal response?