Refer to the diagram. A decrease in demand is depicted by a:
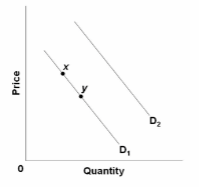
A. move from point x to point y.
B. shift from D 1 to D 2 .
C. shift from D 2 to D 1 .
D. move from point y to point x.
C. shift from D 2 to D 1 .
You might also like to view...
The difference between what a productive resource receives as payment for its use in production and the cost of bringing that resource into production is defined as
a. resource cost b. resource price c. rent d. MRP e. loanable funds
Union membership as a share of the work force is ____ in states with right-to-work laws. (Fill in the blank.)
a. above the national average. b. below the national average. c. greater than 50 percent. d. close to 100 percent.
Reductions in personal income tax rates that increase labor supply and work effort, can be expected to also
a. decrease consumption spending. b. increase consumption spending. c. decrease investment spending. d. increase export sales.
Matt is offered a job driving the campus shuttle bus from 4 p.m. to 6 p.m. each Monday. His reservation wage for this job is $7 per hour. Now suppose the director offers Matt $50 per hour, but also announces that Matt's earnings will be divided equally among Matt and the 99 other students who live in Matt's dorm. What will be Matt's economic surplus from accepting the job?
A. -$6.00 per hour B. -$6.50 per hour C. $0.50 per hour D. $1.00 per hour