From 1950 to 2011, the ratio of real GDP to energy consumption in the United States has been:
A. Relatively constant
B. Slowly decreasing
C. Decreasing steeply
D. Rising significantly
D. Rising significantly
You might also like to view...
According the graph shown, the profit-maximizing decision of the monopolist would be:
This graph shows the cost and revenue curves faced by a monopoly.
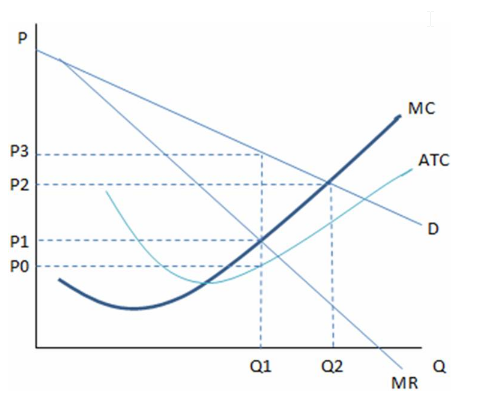
A. Q1, P1.
B. Q1, P3.
C. Q2, P2.
D. Q1, P2.
Consider a firm that employs some resources that are owned by the firm. When accounting profit is zero, economic profit
A. must be negative and shareholder wealth is reduced. B. is sure to be positive. C. must also equal zero. D. cannot be computed accurately, but the firm is breaking even nonetheless.
People will buy more of a normal good when their income decreases.
Answer the following statement true (T) or false (F)
Recall the Application regarding the elasticity of demand for public transit varying over time to answer the following question(s).According to the Application, the demand for public transit in the long run is ________, so a 10 percent increase in the transit fare will decrease ridership by ________.
A. 0.80; 8 percent B. 0.60; 6 percent C. 0.50; 5 percent D. 0.7; 7 percent