Solve the problem by using a nonlinear system.In 1979,  and
and  had the same population. The population of
  continued to increase steadily, while the rate of population growth of
  (although initially less than that of
  )
)
eventually overtook the growth rate of City #2. The populations of two cities are modeled by the following equations:  :
:  ;
;  :
:  , where
  corresponds to the year 1979. In what year after 1979 did the cities have the same population?
A. 1984
B. 1982
C. 1985
D. 1983
Answer: A
You might also like to view...
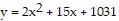
Multiply.
A. 34,610 B. 34,500 C. 34,700 D. 34,600
Plot and interpret the appropriate scatter diagram.The one-day temperatures for 12 world cities along with their latitudes are shown in the table below. Make a scatter diagram for the data. Describe what happens to the one-day temperatures as the latitude increases.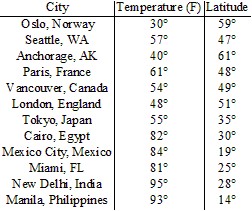 Latitude (degrees)
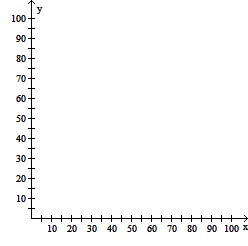 Temperature (F)°
What will be an ideal response?
Write the equation of the function g(x) that is transformed from the given function f(x), and whose graph is shown.f(x) = x2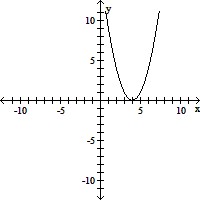
A. y = (x - 4)2 B. y = (x - 4)2 + 1 C. y = x2 - 4 D. y = (x + 4)2
Add and simplify. Write the answer as an improper fraction as needed.  +
+ 
A. 
B. 1
C. 
D. 