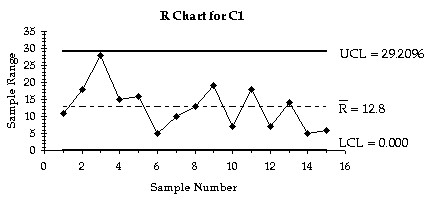
Construct an R chart.A machine is supposed to fill boxes to a weight of 50 lbs. Every 30 minutes a sample of four boxes is tested; the results are given below.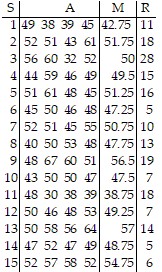

What will be an ideal response?
You might also like to view...
Classify the random variable as either discrete or continuous.The number of field goals kicked in a football game
A. Continuous B. Discrete
Solve the problem.The population of a town was 32,700 at the beginning of 1970. If the population decreased by 400 people per year, how many people lived in the town at the beginning of 1985?
A. 26,700 B. 26,300 C. 6000 D. 27,100
Identify the indicated entry in matrix A.A =  ; identify a12.
A. 8 B. 7 C. 2 D. 5
Plot and interpret the appropriate scatter diagram.The one-day temperatures for 12 world cities along with their latitudes are shown in the table below. Make a scatter diagram for the data. Describe what happens to the one-day temperatures as the latitude increases. Latitude (degrees)
 Temperature (F)°
What will be an ideal response?