Which of the following formulas accurately reflects this graph?
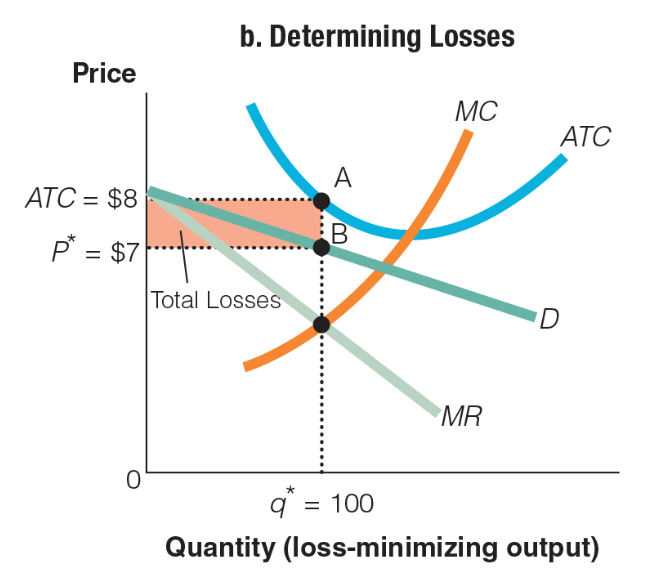
a. P* ($7) + ATC ($8) ? q* (100) = $1,500
b. P* ($7) ? ATC ($8) ? q* (100) = $?100
c. P* ($8) + ATC ($7) ÷ q* (100) = $.15
d. P* ($7) ? ATC ($8) ÷ q* (100) = $?.01
b. P* ($7) ? ATC ($8) ? q* (100) = $?100
You might also like to view...
"If the marginal product of labor curve slopes downward, then the average product of labor curve necessarily must slope downward." Explain whether the previous statement is correct or incorrect?
What will be an ideal response?
In August 1971, President Nixon implemented price and wage controls to combat inflation. Which of the following statements best describes the change in price levels after the price controls policy was implemented?
a. Inflation remained almost the same for many years. b. The rate of inflation decreased and remained around 3 percent throughout 1972. c.. The rate of change in prices fell below zero in mid-1970s. d. Implementation of controls led to an increase in inflation rates in 1972.
When the fishing economy mobilized for war preparedness by drafting young men and women, many draftees came from fishing jobs. Picture the market for fish, before and after the mobilization. What happens to the price and quantity of fish on the market after the draft went into effect?
a. Both fish prices and quantity increased. b. Fish prices increased and quantity remained unchanged. c. The draft had no effect on the fish market. d. Fish prices decreased and quantity increased. e. Fish prices increased and the quantity decreased.
Refer to the graph shown. According to the globalized AS/AD model, which world aggregate supply curve best represents the 2000s?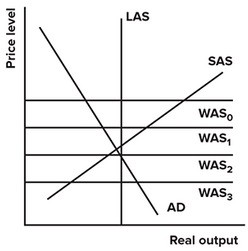
A. WAS0, and the United States had a large trade surplus. B. WAS1, and the United States had a small trade deficit. C. WAS2, and the United States had a small trade surplus. D. WAS3, and the United States had a large trade deficit.