The circle graph below shows the number of pizzas consumed by college students in a typical month. Use the graph to answer the question.  What percent of college students consume more than 7 pizzas in a typical month?
A. 2%
B. 5%
C. 34%
D. 18%
Answer: B
You might also like to view...
The line graph shows the recorded hourly temperatures in degrees Fahrenheit at an airport. Use the graph to answer the question.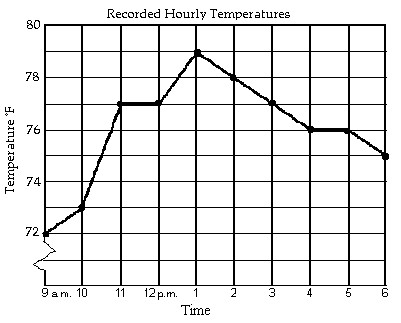 At what time was the temperature the lowest?
A. 10 a.m. B. 1 p.m. C. 9 a.m. D. 6 p.m.
Solve the problem.If PN =  PN-1 and P4 = 108, then P6 =
A. 324. B. 4. C. 12. D. 36. E. none of these
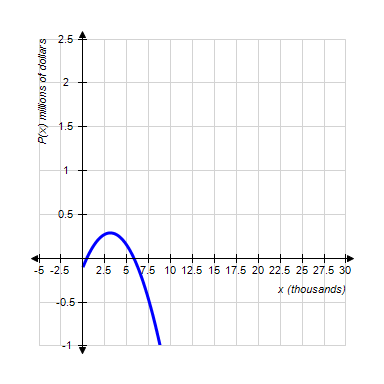
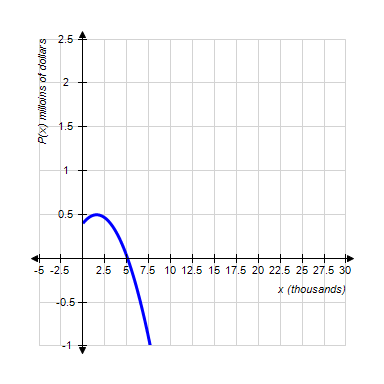
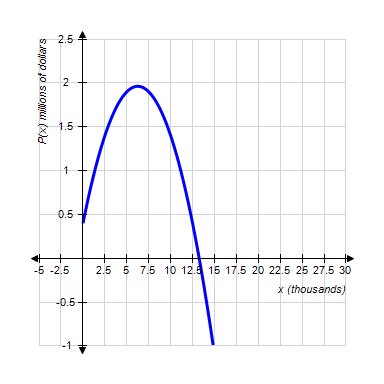
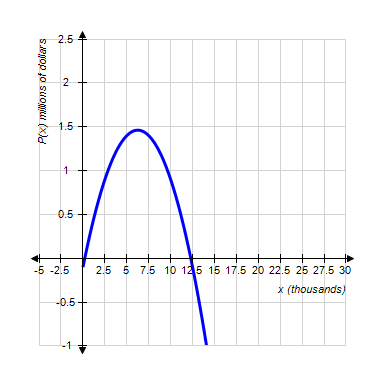
Acrosonic's production department estimates that the total cost (in dollars) incurred in manufacturing x ElectroStat speaker systems in the first year of production will be  . The demand equation is
variablename="impvar_705dea3cd45b43d99ec0f3a36" />. Select the graph of the profit function.
?
A. ?
B. ?

C. ?
D. ?
E. ?
The total daily profit (in dollars) realized by Weston Publishing in publishing and selling its dictionaries is given by the profit function
?

?
where x stands for the number of deluxe editions and y denotes the number of standard editions sold daily. Weston's management decides that publication of these dictionaries should be restricted to a total of exactly 400 copies/day. How many deluxe copies and how many standard copies should be published each day to maximize Weston's daily profit?
?
Find the number of deluxe copies.
?
Find the number of standard copies.
What will be an ideal response?