The production possibility table below is for growing broccoli and asparagus in a 320-square-foot garden in one season.Production PossibilityBroccoliAsparagus30020181026030 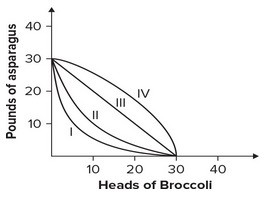 Which curve on the graph on the right corresponds to this table?
A. I
B. II
C. III
D. IV
Answer: D
You might also like to view...
Rational expectations theory suggests that ________
A) policy announcements can impact behavior B) policy announcements have no impact on behavior C) unannounced policies have no impact on behavior D) the optimal forecast is identical to the announced policy
How would a $10 increase in per-unit input costs affect a price-taking firm's supply curve?
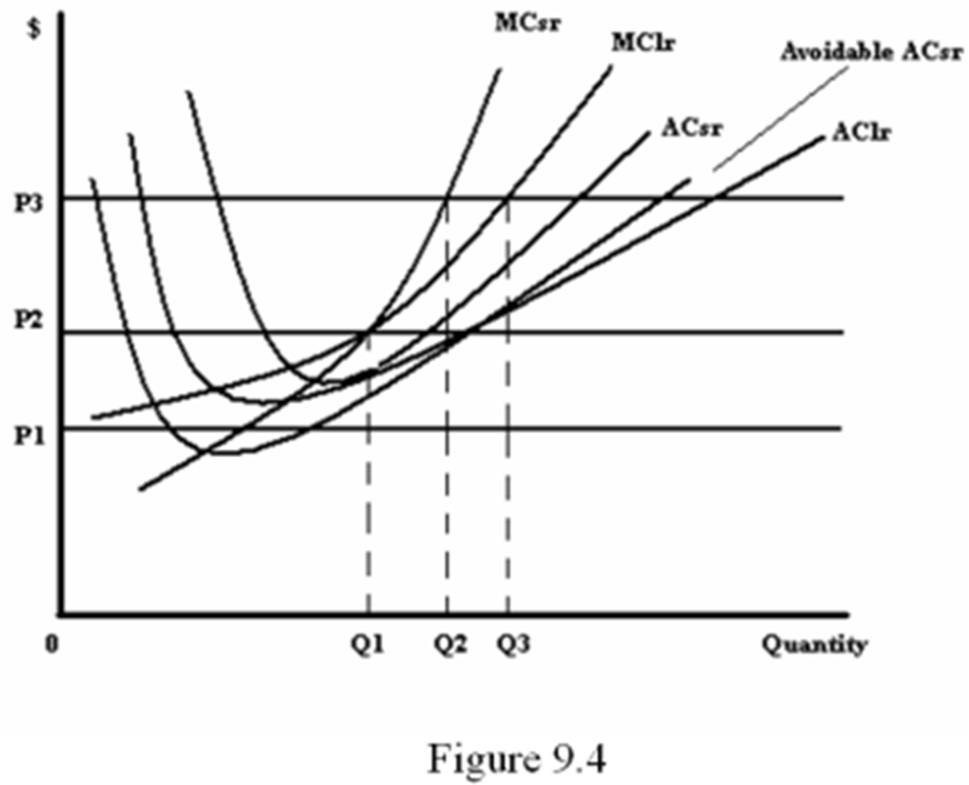
A. MC would increase by $10, and AC would decrease by $10.
B. AC would increase by $10, and MC would decrease by $10.
C. MC and AC would both decrease by $10.
D. MC and AC would both increase by $10.
A firm moves from one SRATC curve to another
a. when it changes the number of workers it employs b. when it has contractual obligations on its plant and equipment c. when it produces more output with the same plant size d. in the short run e. in the long run
A budget will
A) improve your credit standing so you can use borrowing to increase your current consumption. B) All of the above. C) help you focus on those expenditures that you value highly relative to cost. D) make it more attractive for you to buy a car every couple of years.