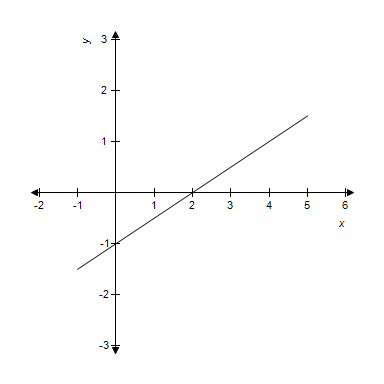
Graph the linear function that models the data given in the table below.
?
x
-1
0
1
2
3
4
5
y
-1.5
-1.0
-0.5
0.0
0.5
1.0
1.5
A. ?
B. ?
C. ?
D. ?
E. ?
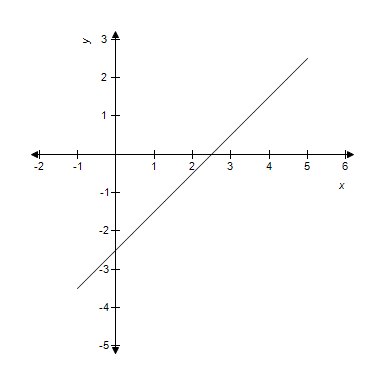
Answer: A
Mathematics
You might also like to view...
Find a formula for the nth term of the sequence.-5, -3, -1, 1, 3 (every other integer starting with -5)
A. an = n - 11 B. an = n - 12 C. an = 2n - 7 D. an = 2n - 6
Mathematics
Solve the problem.The following table shows the proportion of traffic accidents caused by drivers with the given years of driving experience. 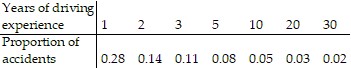 Determine whether a correlation exists between the years of driving experience and the proportion of accidents at
A. No B. Yes
Mathematics
In a parallel capacitive circuit, R = 300 ê and C = 0.01 æF. What is BC when f = 10 KHz?
a. 740 æS b. 628 æS c. 396 æS d. 131 æS e. 100 æS
Mathematics
Use a calculator to find the value of y in degrees rounded to two decimal places.y = tan-1 0.2177
A. 102.57° B. -12.57° C. 12.28° D. 12.57°
Mathematics