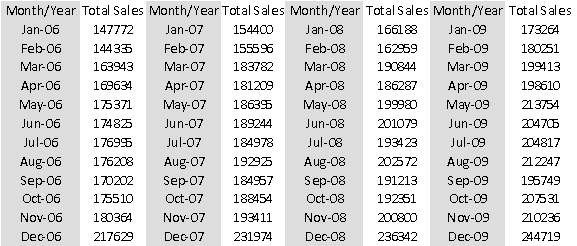
A small sporting goods store is reviewing its sales data over the past decade to determine whether or not to open a new location. The data shown below contains total monthly retail sales (in dollars) for the years 2006-2008, the first three years of its business.

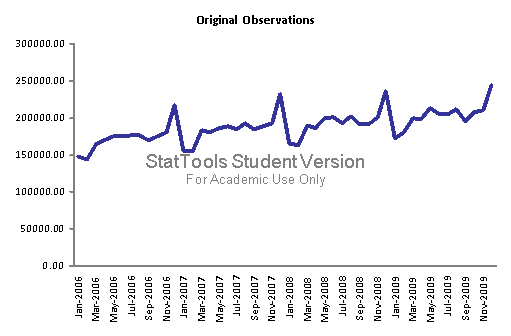
Obtain a time series graph of the data. If you will be using a moving average model of the data, what information does this graph provide to help specify such a model?
What will be an ideal response?
The graph shows a definite seasonal pattern (peak at the end of the year, perhaps due to increased sales in the holiday season), so any moving average model should be deseasonalized. A shorter span will probably also be appropriate, to follow the ups and downs from month to month.
You might also like to view...
Which of the following represents the subset of board of directors that acts as a direct contact between stockholders and the independent accounting firm?
a. External Auditors b. Internal audit staff c. Audit Committee d. Stockholders' representative
On January 1, 2016, the Accounts Receivable and the Allowance for Uncollectible Accounts for Darius Company carried balances of $20,000 and $550 respectively. During the year, the company reported $70,000 of credit sales. There were $400 of receivables written off as uncollectible in 2016 . Cash collections of receivables amounted to $74,700 . The company estimates that it will be unable to
collect 5% of the year-end accounts receivable balance. The amount of bad debts expense recognized in the 2016 income statement will be: a. $545 b. $595 c. $745 d. $795
How would the FAB formula be used in a customer benefit plan?
What will be an ideal response?
List exceptions, if any, to the Employee Polygraph Protection Act's ban on polygraph testing
