Refer to the diagram. The initial aggregate demand curve is AD 1 and the initial aggregate supply curve is AS 1 . Demand-pull inflation in the short run is best shown as:
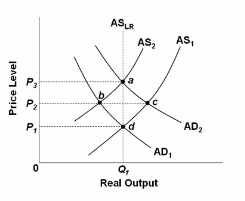
A. a shift of the aggregate demand curve from AD 1 to AD 2 .
B. a move from d to b to a.
C. a move directly from d to a.
D. a shift of the aggregate supply curve from AS 1 to AS 2 .
A. a shift of the aggregate demand curve from AD 1 to AD 2 .
You might also like to view...
Refer to Sales Tax. After the tax is imposed, social gain is equal to
The following questions refer to the accompanying diagram which shows the effects of a sales tax imposed on consumers. The initial price and quantity are P0 and Q0, respectively. After the tax is imposed, the equilibrium quantity is Q1, firms receive the price Ps, and consumers pay the price Pd.
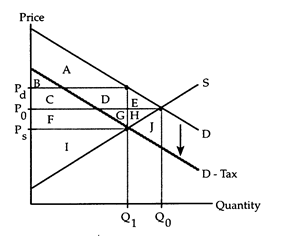
a. area A + D + E + G + H + J.
b. area B + C + F + I - J.
c. area A + B + C + D + E + F + G + H + I.
d. area A + B + C + D + F + G + I.
Refer to the following figure. Which of the following expresses economic growth?
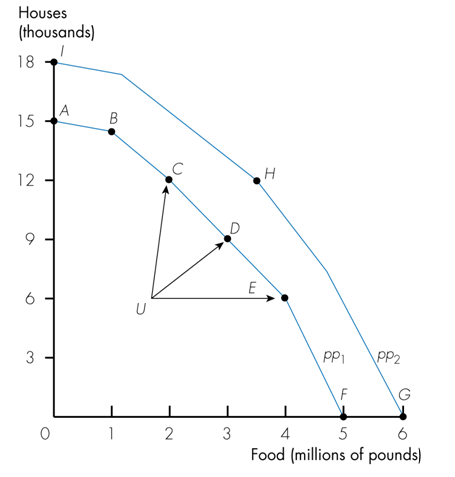
a. Movement from Point U to Point C
b. Movement from Point U to Point D
c. Movement from Point U to Point E
d. A shift of the Production Possibilities Curve from PP1 to PP2
An individual demand curve can be derived from the ________ curve
A) price-consumption B) price-income C) income-substitution D) income-consumption E) Engel
If laborers become more efficient over time, and if the Ajax Company would want to expand production, they would
A) substitute capital for labor. B) hire more laborers. C) hire fewer laborers. D) produce less product.