The Voronoi diagram for a set of K points in the plane is a partition of all the points of the plane into K regions, such that every point (of the plane) is assigned to the closest point among the K specified points. (See Figure 8.5.) What is the relationship between Voronoi diagrams and K-means clusters? What do Voronoi diagrams tell us about the possible shapes of K-means clusters?
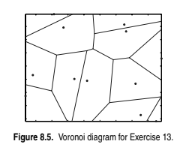
(a) If we have K K-means clusters, then the plane is divided into K Voronoi
regions that represent the points closest to each centroid.
(b) The boundaries between clusters are piecewise linear. It is possible to
see this by drawing a line connecting two centroids and then drawing
a perpendicular to the line halfway between the centroids. This per-
pendicular line splits the plane into two regions, each containing points
that are closest to the centroid the region contains.
You might also like to view...
When a CPU executes each instruction in a program, it uses a process known as the ____________.
a. fetch-decode-execute cycle b. ready-set-go phase c. code assembly process d. compilation sequence
A nested function
A) contains data for the basis of the lookup and data to be retrieved. B) contains another function embedded inside one or more of its arguments. C) looks up a value and returns a related result from the lookup table. D) is the lowest value for a specific category or series in a lookup table.
For a field with thetypevaluenumber, some modern browsers flag or reject non-numerical input.
Answer the following statement true (T) or false (F)
Android users may need supplementary apps to perform the hands-on file manipulation one might expect from a robust operating system.
Answer the following statement true (T) or false (F)