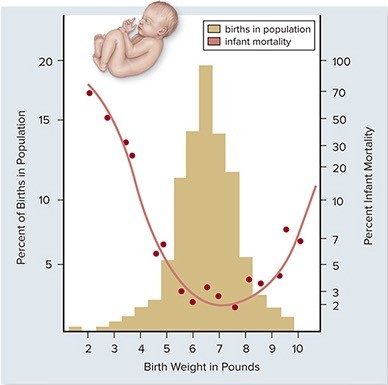
 In the graph above, how can the change in infant mortality be explained as birth weight increases from 2 to 7 pounds?
A. A larger baby will have more developed organs and thus have greater fitness.
B. A baby closer to 7 pounds will not be able to be delivered safely and thus have higher mortality.
C. A baby closer to 2 pounds will not be able to be delivered safely and thus have lower mortality.
D. A baby closer to 7 pounds will have more developed organs and thus have higher mortality.
E. A baby closer to 7 pounds will have more developed organs and thus have lower mortality.
Answer: A
You might also like to view...
Several genetic disorders, including Fanconi anemia and ataxia telangiectasia, are caused by mutations in ____
a. the cell wall b. mitochondrial DNA c. ribosome structure d. DNA repair genes e. DNA polymerase genes
Which city is considered a brown-air city because the pollutants in the air undergo chemical reactions in the sunlight to form smog?
A. Boston B. Philadelphia C. New York D. Los Angeles E. All of the choices are correct.
Who is credited with first observing microorganisms?
A) Robert Hooke B) Anton van Leeuwenhoek C) Robert Koch D) Louis Pasteur E) Carolus Linnaeus
If you remove the ERretention signal from a protein that normally resides in the ER lumen, where do you predict the protein will ultimately end up? Explain your reasoning
What will be an ideal response?