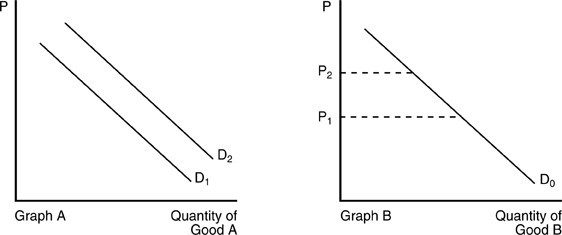
 In the above figure, when the price of Good B increases, the result can be shown by
A. the movement from D1 to D2 in Graph A.
B. the movement along D0 from P2 to P1.
C. the movement along D0 from P1 to P2.
D. the movement from D2 to D1 in Graph A.
Answer: C
You might also like to view...
The division of a resource's earnings between economic rent and opportunity cost depends on the resource owner's
a. elasticity of labor supply b. price elasticity of labor demand c. income elasticity of labor demand d. cross-price elasticity of demand e. marginal revenue product
In the long run in perfect competition, firms will operate at
a. minimum average total cost. b. an average total cost that is just slightly above the minimum. c. an average total cost that is about 10% above the minimum. d. an average total cost that is below price.
Consider two projects. The first project pays benefits of $90 today and nothing else. The second project pays nothing today, nothing one year from now, but $100 two years from now. Which project would be preferred if the discount rate were 0%? What if the rate increased to 10%?
What will be an ideal response?
Suppose that a firm has only one variable input, labor, and firm output is zero when labor is zero. When the firm hires 6 workers it produces 90 units of output. Fixed cost of production are $6 and the variable cost per unit of labor is $10 . The marginal product of the seventh unit of labor is 4 . Given this information, what is the total cost of production when the firm hires 7 workers?
a. $66 b. $76 c. $906 d. $946