Solve.The data set represents a bimonthly progression of gasoline prices over the course of several months in an unspecified city. Use a graphing calculator to determine the quadratic regression equation for this data set. 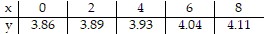
A. y = 0.00268x2 + 0.01107x + 3.85743
B. y = 0.01071x2 + 0.02214x + 3.85743
C. y = 0.00268x2 - 0.01107x + 3.85743
D. y = 0.01071x2 + 0.02214x - 3.85743
Answer: A
You might also like to view...
Provide an appropriate response.(a) Graph the curves r =  and r =
  .(b) Find polar coordinates of the points of intersection of the curves in part (a).(c) Show that at the points of intersection the tangent lines to the curves are perpendicular to each other.
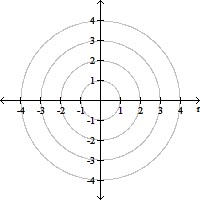
What will be an ideal response?
Evaluate the double integral over the given region.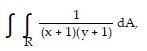 R = {(x, y): 0 ? x ? 3, 0 ? y ? 8}
A. 9 ln 4
B.  ln 4
ln 4
C. ln 36
D. ln 4 ln 9
Solve the problem.Four members are running for president of the Greater New Orleans Stamp Club: Andy (a),  Carol (c), and Denise (d). The voter profile is summarized in the table.
 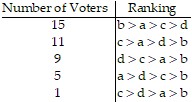 Use the Borda Method to determine the winner.
A. Carol B. Denise C. Brett D. Andy
Use the distributive property to rewrite the expression.-  (-6x + 4y)
A. 3x B. 9x + 6y C. 9x - 6y D. -9x + 6y