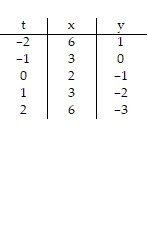
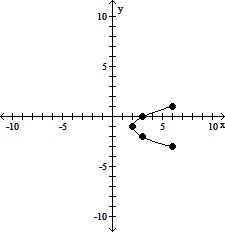
Graph the pair of parametric equations by hand, using values of t in [-2,2]. Make a table of t-, x-, and y-values, using t = -2, -1, 0, 1, and 2. Then plot the points and join them with a line or smooth curve for all values of t in [-2,2]. Do not use a calculator.x = t2 + 2, y = -t - 1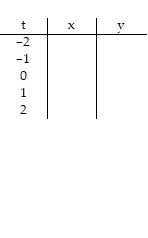

What will be an ideal response?
 ? ? |  |
You might also like to view...
Solve the problem using the quadratic formula.When water runs out of a hole in a cylindrical container, the height of the water in the container can often be modeled by a quadratic function. Assume that the height of the water in a particular metal can with a small hole can be modeled by h = 0.0003x2 - 0.16x + 8, where x is the time (sec) and h is the height (cm). Use the quadratic formula to estimate the time when the height is 2 cm. Round your answer to the nearest second.
A. 48 sec B. 47 sec C. 45 sec D. 41 sec
Graph the function.f(x) = e-x
A. 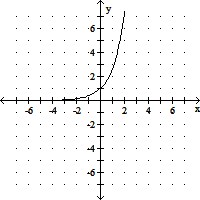
B. 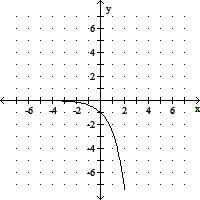
C. 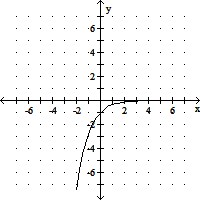
D. 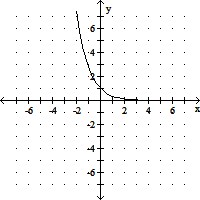
Use the data in the table to construct a line graph.The following table shows the median teacher's salary in District X over several years.Label the x-axis and y-axis for the time and the numerical value variables. 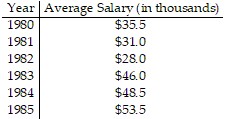
What will be an ideal response?
A cone sliced by a plane results in a type of curve called a conic section. Use the given information and figure to identify the conic section produced in the plane. The plane is perpendicular to the axis of the cone. 
A. parabola B. hyperbola C. ellipse D. circle