Find T, N, and B for the given space curve.r(t) = (ln (cos t) + 8)i + 7j + (5 + t )k, -?/2 < t < ?/2
A. T = (-sin t)i + (cos t)k; N = (-cos t)i - (sin t)k; B = j
B. T = (sin t)i + (cos t)k; N = (cos t)i - (sin t)k; B = -j
C. T = (-sin t)i + (cos t)k; N = (-cos t)i - (sin t)k; B = -j
D. T = (sin t)i + (cos t)k; N = (cos t)i - (sin t)k; B = j
Answer: C
You might also like to view...
Solve.A census was taken to determine the median annual income for residents of a selected region of the United States, by level of education. The given polynomial models describe the median annual income for men, M, and for women, W, who have completed x years of education. Shown in a rectangular coordinate system are the graphs of the polynomial models. Identify the median annual income for a woman with 10 years of education as a point on the appropriate graph.M = 224x2 - 1266x + 20,106W = 287x2 - 4030x + 33,761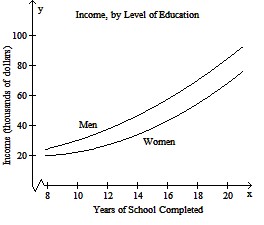
A. (10, 22,161) B. (10, 41,240) C. (10, 58,431) D. (10, 29,846)
Solve the problem.You brake your car from a speed of 65 mph. The table shows data that represent your car's speed versus the amount of time elapsed from the moment that you began to brake.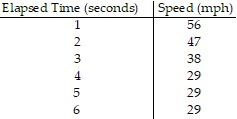 Graph the data. What is the slope of the line segment that represents the period of time during which the speed decreases?
A. 
The slope of the decrease is -10.
B. 
The slope of the decrease is -9.
C. 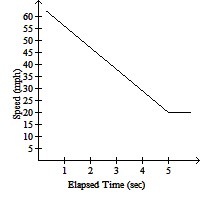
The slope of the decrease is -9.
D. 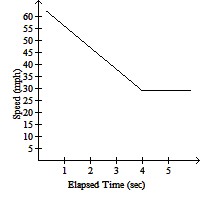
The slope of the decrease is 9.
Solve the problem.Doctors predict that by administering a vaccine, the number of new cases of a certain childhood disease will decrease by half each year. If 1200 people were afflicted with the disease in 2000, estimate the number of new cases in 2005. (Round to the nearest whole number.)
A. 38 new cases in 2005 B. 19 new cases in 2005 C. 75 new cases in 2005 D. 150 new cases in 2005
The graph of a function is given. Determine whether the function is increasing, decreasing, or constant on the given interval.(0, 1)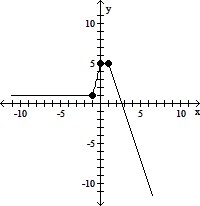
A. increasing B. decreasing C. constant