Refer to the information provided in Figure 14.1 below to answer the question(s) that follow.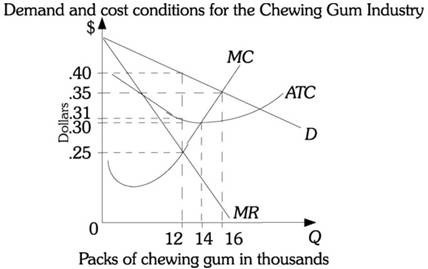 Figure 14.1Refer to Figure 14.1. Six chewing gum producing firms form a cartel. The firms have identical cost structures. If the cartel produces the profit-maximizing output level, each firm should produce
A. 2,000 packs of chewing gum.
B. 6,000 packs of chewing gum.
C. 12,000 packs of chewing gum.
D. indeterminate output levels from this information.
Answer: A
You might also like to view...
If an increase in the price of a product from $1 to $2 per unit leads to a decrease in the quantity demanded from 100 to 80 units, then the value of price elasticity of demand is
a. elastic b. inelastic c. unit elastic d. suggestive of an inferior good e. equal to -20
A rightward shift in the demand curve for a product will ordinarily result from
a. a decrease in the advertising budget. b. a decrease in the price of a competing product. c. an increase in consumer income. d. an increase in the price of a complementary good.
Equilibrium GDP can be depicted graphically as that point where the _________ and _________ cross.
Fill in the blank(s) with the appropriate word(s).
Refer to the information provided in Figure 3.19 below to answer the question(s) that follow.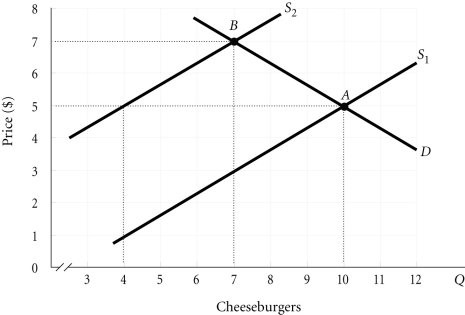 Figure 3.19Refer to Figure 3.19. The market is initially in equilibrium at Point B. If supply shifts from S2 to S1, the equilibrium price will change from ________ and the equilibrium quantity will change from ________.
A. $5.00 to $7.00; 4 to 7 B. $7.00 to $5.00; 7 to 10 C. $7.00 to $5.00; 7 to 4 D. $5.00 to $7.00; 10 to 7