The above figure shows Bobby's indifference map for juice and snacks. Also shown are three budget lines resulting from different prices for snacks assuming he has $20 to spend on these goods
Which of the following points are on Bobby's demand curve for snacks? A) p = 2, q = 10
B) p = 2, q = 13
C) p = 2, q = 5
D) p = 1, q = 20
C
You might also like to view...
Economists use the term variable costs to refer to
a. prices of inputs that are subject to sudden change, like fuel. b. an increase in the price of any input. c. costs that vary with the type of final product being produced. d. costs that vary with the quantity of output produced.
The economy pictured in the figure has a(n) ________ gap with a short-run equilibrium combination of inflation and output indicated by point ________. 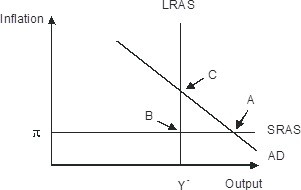
A. recessionary; A B. recessionary; C C. recessionary; B D. expansionary; A
A relatively larger proportion of ____ work in unskilled jobs with lower pay than do ____
a. females; Caucasian males b. nonwhites; Caucasian males c. Caucasian males; females d. Both (a) and (b) are correct.
The neighborhood ice cream shop finds that when it charges $3 per ice cream cone, its total revenues are $90,000. It has total variable costs of $30,000 and total fixed costs of $40,000. From this we can infer the:
A. shop sells 10,000 ice cream cones. B. price is less than average total cost. C. economic profits are $20,000. D. shop will be closed in the long run.