Complete the table.
A. 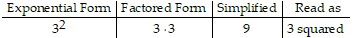
B. 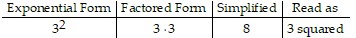
C. 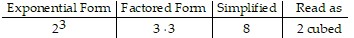
D. 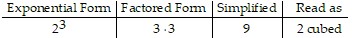
Answer: A
You might also like to view...
Create a graphical display for the data given. You may choose any graphic type that you feel is appropriate. Write a few sentences explaining why you chose this type of display and a few sentences describing any interesting patterns in the data.The table below gives information about U.S. families with children under the age of 18. The table shows the percentage of these families that are two-parent families, the percentage that are maintained by a single mother, and the percentage that are maintained by a single father. U.S. Families with Children Under 18 ?
?
What will be an ideal response?
The line graph shows the pollution rate for a certain lake over six decades. Use the graph to answer the question. 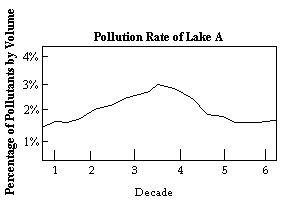 Find an estimate for the pollution rate of the lake at the beginning of decade 6.
A. 1.5% B. 3% C. 1% D. 2.5%
Solve.A square sheet of paper measures 33 centimeters on each side. What is the length of the diagonal of this paper? Round to the nearest tenth.
A. 66 cm B. 2178 cm C. 33 cm D. 46.7 cm
Given the term, idenitfy the coefficient, the variable, and the exponent of the variable.15x
A. coefficient: x variable: 15 exponent: 1 B. coefficient: 15 variable: x exponent: 1 C. coefficient: x variable: 15 exponent: 0 D. coefficient: 15 variable: x exponent: 0