Given the data in the above table, income of $13, a price of $1 for a bottle of water and $2 for a hamburger, what is the marginal utility per dollar spent on water and on hamburgers when the consumer is in consumer equilibrium?
A) 20 units of utility per dollar spent
B) 10 units of utility per dollar spent
C) 5 units of utility per dollar spent
D) 1 unit of utility per dollar spent
C
You might also like to view...
If the value of the U.S. dollar appreciates in foreign exchange markets then this will likely cause
a. the relative price of American exports to rise for foreigners interested in buying U.S. exports. b. the relative price of American imports to fall for Americans interested in buying U.S. imports. c. U.S. exports to fall and U.S. imports to rise creating a balance of trade deficit. d. All of the above.
A demand curve is graphed to show the relationship of the _______________ of a good on the vertical axis with the _____________ of the good on the horizontal axis.
a. price/quantity b. quantity/demand c. demand/utility d. utility/price
Assume that the share of population employed in all countries is 50 percent. Based on the information in the table, which country has the highest real GDP per capita? CountryPopulation (millions)Average Labor Productivity ($)A1002,000B15010,000C7525,000D25050,000E9560,000
A. Country B B. Country A C. Country D D. Country E
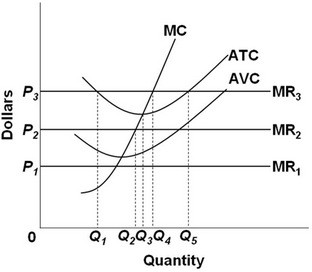 Refer to the above diagram. All data are for the short run. The firm represented in this diagram is selling under conditions of:
A. pure competition. B. pure monopoly. C. oligopoly. D. monopolistic competition.