 The above graph represents a:
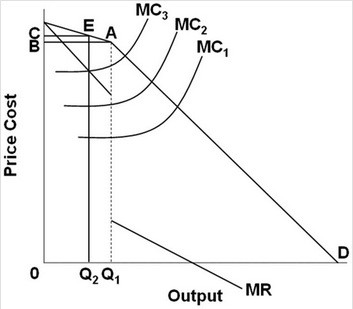
A. monopolistically competitive firm.
B. noncollusive oligopoly firm.
C. monopoly firm.
D. collusive oligopoly firm.
Answer: B
You might also like to view...
What are the two different types of relationships that variables can have? Explain each. What do these relationships look like when they are graphed?
What will be an ideal response?
The aggregate supply-aggregate demand model suggests that the government can stabilize an economy that experiences a sudden and unexpected decline in consumer confidence and aggregate demand by:
What will be an ideal response?
If disposable income decreases from $1800 to $1500 and MPC = 0.75, then saving will:
A. Increase by $225 B. Decrease by $225 C. Increase by $75 D. Decrease by $75
Between 1974 and 2006, hog prices
A. rose far faster than inflation. B. rose at about the overall rate of inflation. C. rose far slower than inflation. D. remained largely constant even in nominal terms.