Refer to the graph shown.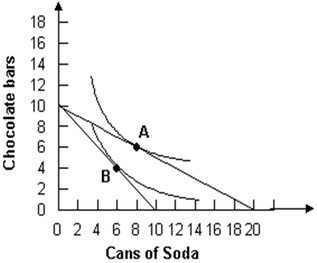 The diagram demonstrates that an increase in the price of soda will:
A. raise the quantity demanded of chocolate bars.
B. reduce the quantity demanded of soda.
C. raise the quantity demanded of soda.
D. raise the consumer's available income.
Answer: B
You might also like to view...
Purchasing power parity is the theory that, in the long run, exchange rates should be at a level such that equivalent amounts of any country's currency
A) should earn the same real rate of return. B) are valued inversely relative to the size of its GDP. C) will equalize nominal interest rates across countries. D) allow one to buy the same amount of goods and services.
What is MFN status? How does the WTO reconcile the principle of equal treatment with the preferential treatment created by regional trade agreements?
What will be an ideal response?
The level of income is unchanged in response to anticipated anti-inflation policy in ________
A) real business cycle theory B) traditional Keynesian theory C) new Keynesian theory D) post classical theory
E&S Cooling Co. installs air conditioning systems in new houses for homebuilders and replacement systems for homeowners. Sales of which systems are included in this year’s GDP?
A. Sales of replacement systems B. Sales of both systems C. Sales of systems in new houses D. Neither system would be included, because they are always intermediate goods