?The budget line on a graph represents choices which exhaust all resources.
Answer the following statement true (T) or false (F)
True
Rationale: The budget line represents all combinations of goods that, if chosen by a particular consumer would leave no money in his or her budget.
You might also like to view...
The figure above shows the U.S. demand and U.S. supply curves for cherries. At a world price of $2 per pound, the total imports of cherries to the United States from other nations equals
A) 200,000 pounds. B) 400,000 pounds. C) 600,000 pounds. D) 800,000 pounds. E) 0 pounds.
The t-statistic is computed by
A) dividing the regression coefficient by the standard error of the estimate. B) dividing the regression coefficient by the standard error of the coefficient. C) dividing the standard error of the coefficient by the regression coefficient. D) dividing the R2 by the F-statistic.
The demand for Healthy Bars, a health snack bar, is Qd = 10 - (2 × P) and Healthy Bars has a constant average cost of $3 per snack bar. If Healthy Bars wants to package their bars to create an all-or-nothing offer, what is the profit-maximizing number of bars to put into a package?
A) 2 B) 4 C) 10 D) 6
This graph depicts the demand for a normal good.
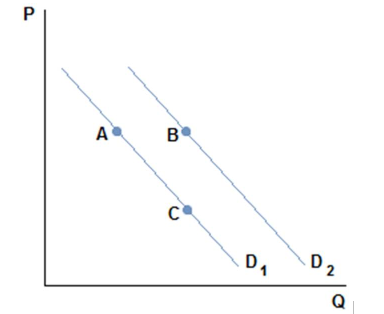
A shift from A to B in the graph shown for a normal good might be caused by:
A. an increase in price.
B. a decrease in price.
C. an increase in income.
D. a decrease in income.