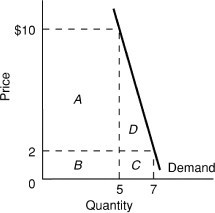
 Use the above figure. When the price increases from $2 to $10, total revenue
A. increases from areas B + C to areas A + D and demand is elastic.
B. increases from areas A + B to areas B + C and demand is inelastic.
C. increases from areas B + C to areas A + B and demand is inelastic.
D. increases from areas C + D to areas B + A and demand is elastic.
Answer: C
You might also like to view...
On a price/quantity graph, a straight horizontal demand curve
a. has zero price elasticity. b. is perfectly elastic. c. is perfectly inelastic. d. is perfectly unit elastic.
Refer to Figure 7-4. When the price falls from P1 to P2, which area represents the increase in consumer surplus to new buyers entering the market?
a. BDF b. BCGD c. AFG d. ABC
A decrease in the price level will cause:
A. a movement rightward along the short-run aggregate supply curve. B. the aggregate demand curve to shift to the right. C. the long-run aggregate supply curve to shift to the right. D. the short-run aggregate supply curve to shift to the right.
The average expected rate of return of a financial asset equals:
A. the rate that compensates for time preference plus the rate that compensates for risk. B. the rate that compensates for time preference plus the rate of inflation. C. beta plus the rate that compensates for risk. D. the risk-free interest rate plus the rate of inflation.