Solve by graphing. Label the axes and show where the solution is located on the graph.The graph depicts a relationship between scores achieved on an unspecified standardized test and family income. Suppose the score for a test is 490 when the family income is $25,000 and is 530 when the family income is $55,000. Let x be the income and y be the score of the test. Graph the two given pairs of incomes and scores. Assume that the relationship is linear. Draw a line though the two previous points. From your graph, estimates the score if the family income is $40,000.
A. 
550
B. 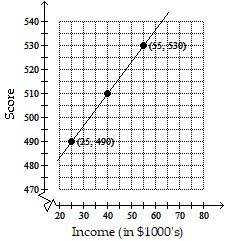
510
C. 
570
D. 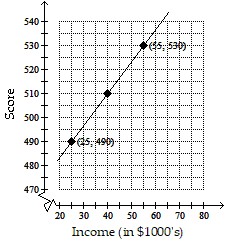
530
Answer: B
Mathematics
You might also like to view...
Find  and
and  .f(x, y) = ln
A.  =
=  ;
;  =
= 
B.  = -
= -  ;
;  =
= 
C.  = -ln
= -ln ;
;  = ln
= ln 
D.  = -ln
= -ln  ;
;  = ln
= ln 
Mathematics
Solve the problem.The graph below shows the position s = f(t) of a body moving back and forth on a coordinate line. (a) When is the body moving away from the origin? Toward the origin? At approximately what times is the (b) velocity equal to zero? (c) Acceleration equal to zero? (d) When is the acceleration positive? Negative?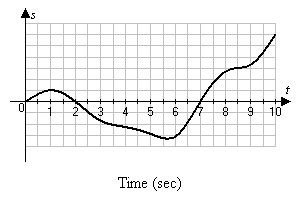
What will be an ideal response?
Mathematics
Solve.83x = 2x + 1 (Round to the nearest thousandth.)
A. 0.125 B. 1.333 C. 0.333 D. 0.500
Mathematics
Find the least common denominator (LCD). ,
, 
A. 3(x - 4)(x - 3) B. 3(x + 4)(x - 3) C. 3(x + 4)(x + 3) D. 3(x - 4)(x + 3)
Mathematics