Refer to the graphs below. Which graph shows a change in the buyer's income, but no changes in the prices of X and Y?
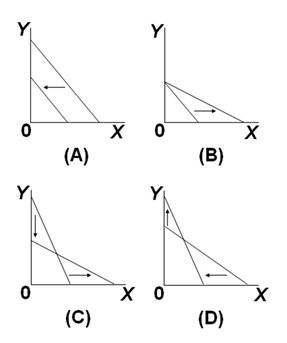
A. Graph A
B. Graph B
C. Graph C
D. Graph D
A. Graph A
You might also like to view...
Suppose a particular production process results in a large amount of pollution and the government decides to impose a tax to correct for this externality, such that the socially optimal output will be produced. The tax will have the effect of shifting the
A. marginal private benefit curve to the right. B. marginal social benefit curve to the right. C. marginal private cost curve to the left. D. marginal social cost curve to the left. E. marginal private cost curve to the right.
The substitution by consumers of one good for another because of relative price changes is:
A. not captured by the CPI and causes the CPI to overestimate the cost-of-living changes. B. captured by the CPI and causes the CPI to overestimate the cost-of-living changes. C. not captured by the CPI and causes the CPI to underestimate the cost-of-living changes. D. captured by the CPI and causes the CPI to underestimate the cost-of-living changes.
The introduction of a tax by the government will _____
Fill in the blank(s) with the appropriate word(s).
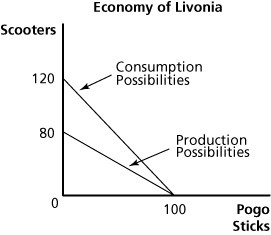 Figure 18.3Refer to Figure 18.3. The opportunity cost of producing scooters in Livonia is:
A. 2/3 of a pogo stick. B. 6/5 of a pogo stick. C. 1.5 pogo sticks. D. 1.25 pogo sticks.