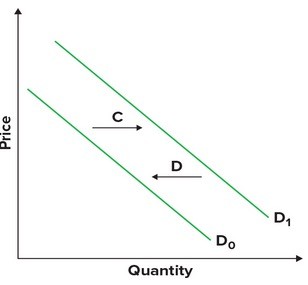
Refer to the graphs shown. If consumers began purchasing more of this product due to a decrease in price, this would be shown by arrow: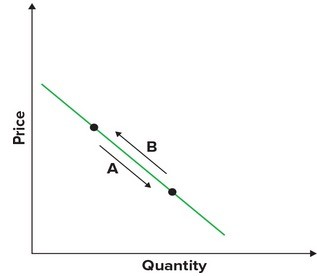
A. A.
B. B.
C. C.
D. D.
Answer: A
You might also like to view...
According to the graph shown, the change in producer surplus brought about by the introduction of a tariff is:
This graph demonstrates the domestic demand and supply for a good, as well as a tariff and the world price for that good.
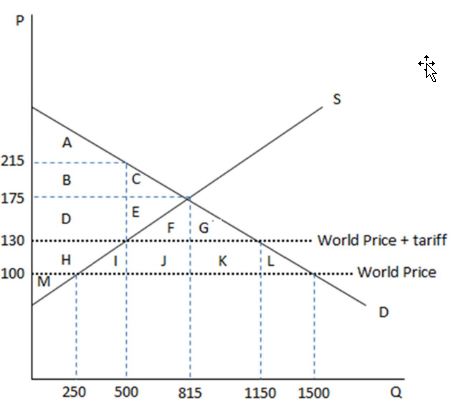
A. a loss of HIJKL.
B. an increase of HIJKL.
C. a loss of H.
D. an increase of H.
In 2009, actual output in the U.S. was 4.7 percent below the potential output. This implies that the: a. unemployment in the U.S. was below its natural rate. b. poverty level in the U.S. was below average. c. there was a recessionary gap in this economy
d. there was an expansionary gap in this economy. e. there was an excess demand in this economy.
For a given year, GDP includes the market value of the following:
A. stocks and bonds. B. bartered goods. C. services. D. land. E. second-hand cars.
Exhibit 12-3 Lorenz curve for an economy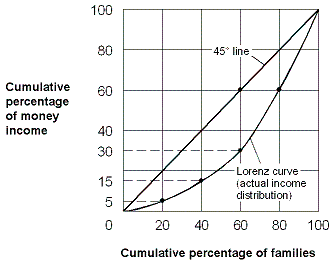 If this economy's distribution of income becomes more equal, then the Lorenz curve shown in Exhibit 12-3 will:
A. move closer to the 45° line. B. become more bowed outward. C. lie above the 45° line. D. shift down and to the right.