In October 2012, the largest liability of the Fed was
A) currency in circulation.
B) reserves.
C) discount loans to banks.
D) vault cash.
B
You might also like to view...
Consider each pair of strategies other than UP,RIGHT. Which of the following statements is not true about those pairs?
a. They are all Pareto Optimal. b. None of them are a Nash Equilibrium. c. The players would not mutually agree to play any of them if such an agreement were possible. d. Each requires that a player play a dominate strategy.
In economics, the term "marginal" usually refers to
a. a small change in an economic variable b. a low-quality product or resource c. an unimportant and irrelevant economic variable d. an all-or-nothing economic decision e. a footnote or minor point
Which one of the following labor resources will likely have the most inelastic supply schedule in the short run?
a. filling station attendants b. sales clerks c. construction laborers d. dentists
Deborah has 80 hours per week to devote to working or to leisure. She is paid an hourly wage and can work at her job as many hours a week as she likes.
The following graph illustrates Deborah's weekly income-leisure tradeoff. The three lines labeled BC1BC1, BC2BC2, and BC3BC3 illustrate her time allocation budget at three different wages; points A, B, and C show her optimal time allocation choices along each of these constraints.
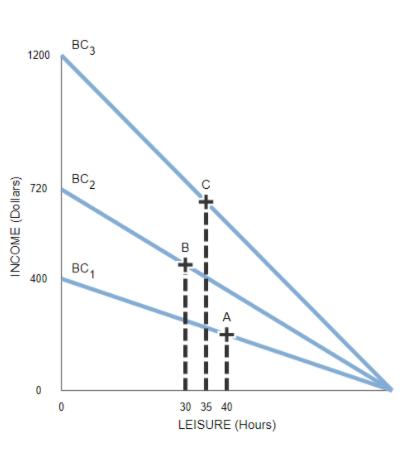
For each of the points listed, use the preceding graph to complete the following table by indicating the hourly wage at each point and how many hours per week Deborah will spend during leisure activities versus working.
| Point | Wage | Leisure | Labor |
|---|---|---|---|
| (Dollars per hour) | (Hours) | (Hours) | |
| A | |||
| B | |||
| C |
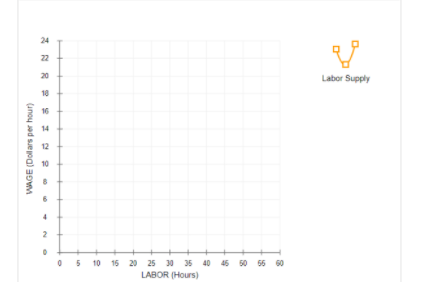
Based on the data you entered in the preceding table, use the orange curve (square symbols) to plot Deborah's labor supply curve on the following graph, showing how much labor she supplies each week at each of the three wages.
Suppose that Deborah's initial budget line was BC1BC1 and that it then changed to BC2
BC2; therefore, Deborah's optimal time allocation choice shifted from A to B. As a result of this change, Deborah's opportunity cost of leisure (decreased/increased) , and she chose to consume (less/more) leisure. Consequently, in this region, the (income/substitution) effect dominates the (income/substitution) effect. The corresponding portion of Deborah's labor supply curve is (upward sloping/downward sloping) .