Graph using the slope and y-intercept.y = x - 2
A. 
B. 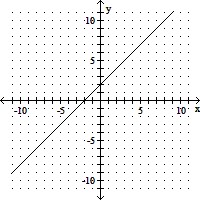
C. 
D. 
Answer: D
You might also like to view...
The graph below shows estimated world population for the period 4000 BC - 2000 AD. Note that the logarithm of the world population and not actual population is plotted on the vertical axis. This means, for example, that when the graph reaches 7 on the vertical scale, world population is 107 and when the graph reaches 9 on the vertical scale, world population is 109. Log World Population 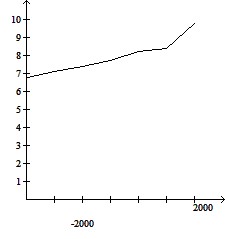 ? Year Use the graph to answer the question. How does world population in the year 1000 AD compare with world population in the year 2000 BC?
A. The 1000 AD population is roughly 14% larger than the 2000 BC population. B. The 1000 AD population is roughly ten million larger than the 2000 BC population. C. The 1000 AD population is roughly ten times as large as the 2000 BC population. D. The 1000 AD population is roughly one million larger than the 2000 BC population.
Decide whether the statement is true or false.
?
 ?
?
A. False B. True
Provide an appropriate response.Find all complex square roots of z = 4 + 4 i. Write each root in rectangular form.
A.  -
-  i, -
i, -  +
+  i
i
B.  +
+  i, -
i, -  -
-  i
i
C. -  -
-  i,
i,  -
-  i
i
D.  +
+  i, -
i, -  -
-  i
i
Three boxes-I, II, and III-contain three red and two green chips, two red and four green chips, and four red and five green chips, respectively. A box is selected at random and a chip is drawn at random from the box .Given the the chip is green, what is the probability that it came from box II?
Fill in the blank(s) with the appropriate word(s).