An increase in aggregate demand is shown by
A. a rightward shift in the aggregate demand curve.
B. the movement down along the aggregate demand curve.
C. a leftward shift in the aggregate demand curve.
D. a movement up along the aggregate demand curve.
Answer: A
You might also like to view...
Refer to Figure 27-1. Suppose the economy is in a recession and expansionary fiscal policy is pursued. Using the static AD-AS model in the figure above, this would be depicted as a movement from
A) C to B. B) A to B. C) A to E. D) B to C. E) B to A.
In the game in Scenario 13.5,
A) there is one equilibrium: for both to expand West. B) there is one equilibrium: for both to expand South. C) there are two equilibria: either can expand in the West, and the other expands in the South. D) there is only a mixed strategies equilibrium. E) all four outcomes are equilibria.
The CPI was 120 in 2000 and 132 in 2001. Dorgan borrowed money in 2000 and repaid the loan in 2001. If the nominal interest rate on the loan was 12 percent, then the real interest rate was
a. 2 percent. b. 10 percent. c. 12 percent. d. 22 percent.
Using Figure 1 above, if the aggregate demand curve shifts from AD2 to AD1 the result in the long run would be: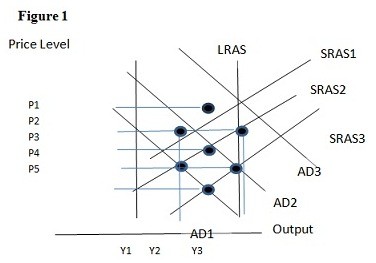
A. P4 and Y1. B. P4 and Y2. C. P5 and Y1. D. P5 and Y2.