Use the diagram of two product supply curves to answer the following question.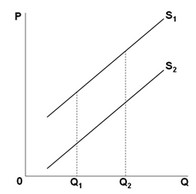 The diagram indicates that
A. over range Q1Q2 price elasticity of supply is the same for the two curves.
B. over range Q1Q2 price elasticity of supply is greater for S2 than for S1.
C. over range Q1Q2 price elasticity of supply is greater for S1 than for S2.
D. not enough information is given to compare price elasticities.
Answer: C
You might also like to view...
In January 2013, the world's cheapest Big Macs were sold in
A) the Philippines. B) Russia. C) China. D) Malysia. E) the Czech Republic.
Ensuring that all information relevant for the pricing of securities is available to the public is the responsibility of the
A) Federal Reserve. B) Securities and Exchange Commission. C) New York Stock Exchange. D) NASD.
Suppose an individual consumes just pizza and soda. Using a graph, explain how the substitution bias causes the Lespeyres price index to overstate the true change in the cost of living resulting from an increase in the price of pizza.
What will be an ideal response?
The marginal income tax rate is equal to
A. the change in the tax payment divided by the change in income. B. the percent of total income that goes to taxes. C. the average tax payment divided by the total tax payment. D. the total tax payment divided by total income.