Refer to the above figure. At a price of $2 per gallon, there is
A) a surplus of 20,000 gallons per month.
B) a shortage of 40,000 gallons per month.
C) a shortage of 80,000 gallons per month.
D) a shortage of 60,000 gallons per month.
D
You might also like to view...
In the United States, the emergence of the third-party payment system has:
A. led health care costs to increase over time. B. had almost no impact on health care costs. C. led people to consume less than the socially optimal level of health care. D. led health care costs to decrease over time.
Use the following graph for the milk market to answer the question below. 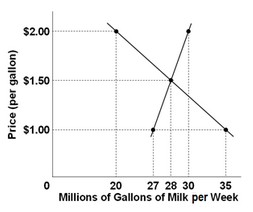 In this market, the equilibrium price is ________ and equilibrium quantity is ________
A. $1.50 per gallon; 28 million gallons. B. $28 per gallon; 150 million gallons. C. $1.00 per gallon; 35 million gallons. D. $1.50 per gallon; 30 million gallons.
Use the following table to answer the next question. The base year is 2007. Hot DogsBaseballsBottles of SodaYearPriceQuantityPriceQuantityPriceQuantity2005$2.00100$5.0050$2.0010020064.001005.001002.0015020076.001005.001002.0020020088.001508.002004.00200200910.0020010.002004.00250Real GDP (constant dollars) for 2005 equals ________.
A. $1500 B. $1050 C. $650 D. $100
Use the following statements to answer this question: I. Corporate paper rates are typically less than one percent higher than Treasury bill rates. II. Treasury bill rates may be viewed a short-term, risk-free rates
A) I and II are true. B) I is true and II is false C) II is true and I is false D) I and II are false