Use the following graph of the demand for noodles to answer the question below.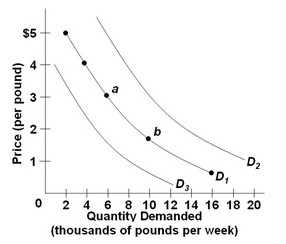 Refer to the three demand curves for noodles and assume noodles are an inferior good. Which of the following would shift the demand for noodles from D1 to D2?
A. an increase in consumer incomes
B. a decrease in consumer incomes
C. a decrease in the price of noodles
D. an increase in the price of noodles
Answer: B
You might also like to view...
The short-run Phillips curve suggests what policy making implications?
A) Using discretionary policies, it may be possible to achieve just the right unemployment and inflation mix. B) Active policy making does not yield any predictable results. C) Maintaining both the inflation and unemployment rates at low levels is possible if policy makers will rely solely on nondiscretionary policy making. D) Passive policy making is more effective than active policy making.
The main policy-making body of the Federal Reserve System is the Federal Open Market committee
Indicate whether the statement is true or false
The commercial banks in Lendland have
Reserves $400 million Loans $3,600 million Deposits $4,000 million Total assets $4,600 million The banks hold no excess reserves. a) Calculate the banks' reserve ratio. b) An immigrant arrives in Lendland with $5 million, which he deposits in a bank. How much does the immigrant's bank lend initially?
In the Brander-Spencer model the subsidy raises profits by more than the subsidy because of
A) the "multiplier" effect of government expenditures. B) the military-industrial complex. C) the forward and backward linkage effects of certain industries. D) the deterrent effect of the subsidy on foreign competition. E) the economies of scale once the company enters the market.