Refer to the information provided in Figure 2.5 below to answer the question(s) that follow.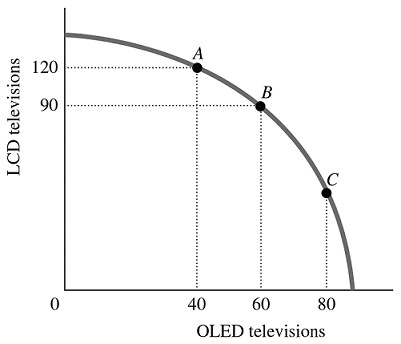 Figure 2.5Refer to Figure 2.5. The best point for society would be
A. either Point B or Point C, as the total amount being produced at either of these points is approximately the same.
B. at any of the labeled points, as all of the points represent an efficient allocation of resources.
C. Point C, as at this point there are approximately equal amounts of LCD and OLED televisions being produced.
D. indeterminate from this information, as we don't have any information about the society's desires.
Answer: D
You might also like to view...
According to the graph shown, area B represents:
These are the cost and revenue curves associated with a monopolistically competitive firm.
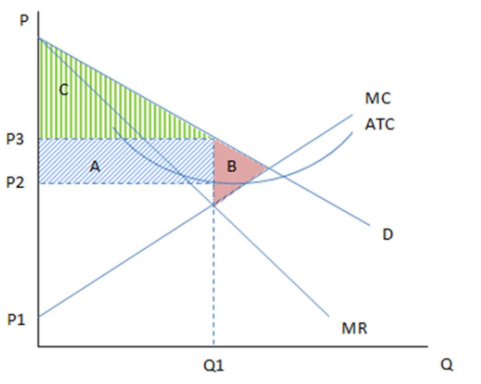
A. profits earned in the short run.
B. consumer surplus.
C. producer surplus.
D. deadweight loss.
If there are no profits in competitive equilibrium, why do firms produce? How can they stay in business?
The Average Product of Labor is
A) the change in total product resulting from an extra unit of labor, holding other factors constant. B) the ratio of output to the number of workers used to produce that output. C) the amount of output that can be produced by a given amount of labor. D) equal to the marginal product of labor when the average product is increasing.
The indifference curve in the diagram yields Juan 100 units of utility. If Juan's money income were to increase by 20 percent, the indifference curve would:
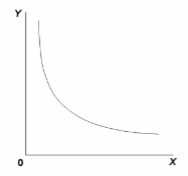
A. shift leftward.
B. shift rightward.
C. become steeper.
D. not be affected.