The graph of 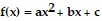 is given in the figure. State whether
  or
or 
A. a < 0
B. a > 0
Answer: B
You might also like to view...
Determine if the ordered pair is a solution to the given inequality.x2 - xy > 49; 
A. Yes B. No
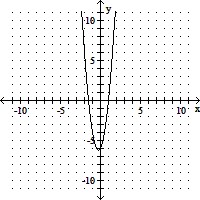
Use the percentage method of withholding to find the federal withholding tax, a 6.2% FICA rate to find the FICA tax, and 1.45% to find the Medicare tax. Then find the net pay for the employee. Assume that the employee has not earned over $110,000 so far this year.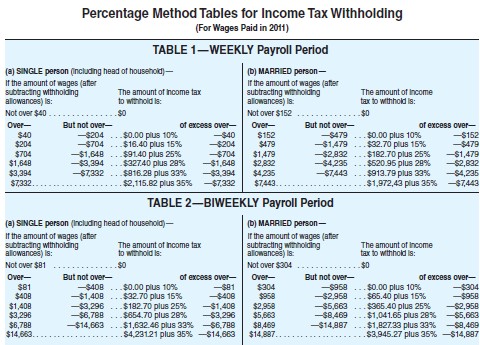
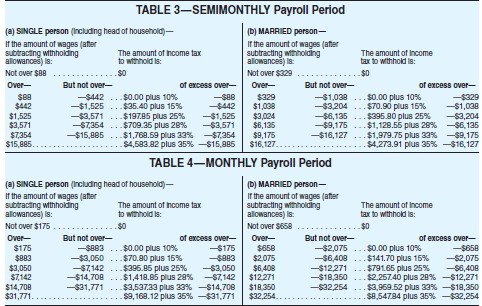
 Fred Jones has gross earnings of $4723.08 biweekly. He is married and has 2 withholding allowances.
A. $3987.56 B. $5097.29 C. $3626.25 D. $4361.77
Solve.The strawberry yield (in bushels per acre) for a farm in Springfield from 1996 through 1998 is given by the equation  In this equation, x = 0 represents the year 1997. Assume this trend continues and predict the year in which the Springfield farm's strawberry yield will be 177 bushels per acre.
A. 2003 B. 2004 C. 2002 D. 2005
Divide to find the exact answer. Express the answer as a whole or mixed number when possible and simplify.2 ÷ 1
÷ 1
A. 2
B. 2
C. 2
D. 3