Write the quotient in the standard form.
A.  -
-  i
i
B.  -
-  i
i
C.  -
-  i
i
D.  -
-  i
i
Answer: D
You might also like to view...
A new chocolate company is estimating how many candy bars per week college students will consume of their line of products. The graph shows the probable number of candy bars students (age 18-22) will consume from year 0 to year 10. B(x) gives the number of candy bars for boys, G(x) gives the number of candy bars for girls, and T(x) gives the total number for both groups. Use the graph to answer the question.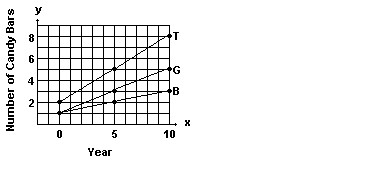 Use the slopes of the line segments to decide in which period (0-5 or 5-10) the number of candy bars per week increased more rapidly.
A. 0-5 B. 5-10 C. The number of candy bars increased at the same rate in both periods
Solve.Find the volume. Use V = lwh.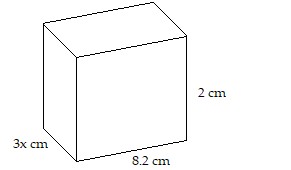
A. 12x cu cm B. 49.2x cu cm C. 73.8x cu cm D. 134.48x cu cm
Round the money amount to the specified place.$2.379 to the nearest cent.
A. $2.38 B. $2 C. $2.4 D. $2.37
The graph of the function f is shown below. Match the function g with the correct graph.g(x) = -f(-x) - 3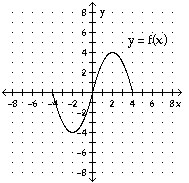
A. 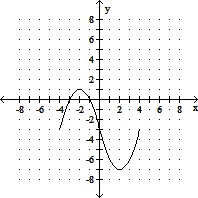
B. 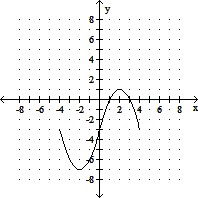
C. 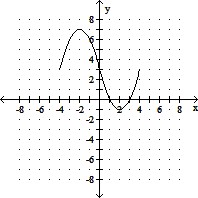
D.