The U.S. National Commission on Fiscal Policy and Reform has recommended changes to government expenditures and taxes which they claim would reduce the increase in the national debt between 2012 and 2020 to $4 trillion rather than $8 trillion
What are the commission's 5 recommendations?
1. Eliminate or reduce tax breaks for home mortgage interest, employer health care coverage, the tax exemption for municipal bonds, and preferential tax rates for capital gains and dividend income.
2. Increase the federal government tax on gasoline by 15 cents a gallon.
3. Increase taxes on higher-income households by raising or eliminating the income cap on Social Security payments.
4. Cap federal spending such as farm subsidies and defense spending.
5. Increase the retirement age from 67 to 69 in the future to reduce Social Security expenditures, and significantly increase Medicare premiums.
You might also like to view...
A nation will neither export nor import a specific product when its
A. export supply curve lies above its import demand curve. B. export supply curve is upward-sloping. C. domestic price equals the world price. D. import demand curve is downward-sloping.
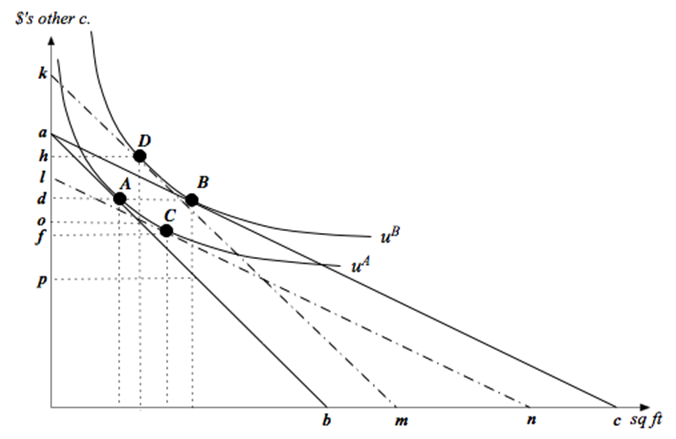
Consider a household with income I and two goods to choose from - square feet of housing (x1) and dollars of other consumption (x2). The annual price per square foot of housing is p, and the household's tastes can be described by the utility function u(x1,x2)= x10.25x20.75. a. How much housing and other goods will the household demand as a function of p and I. b. Suppose income is $100,000 and the price of housing is $10 per square foot. Then the government introduces a subsidy that lowers the housing price to $5 per square foot. In the attached graph, let the solid lines denote the budget lines of the household before and after the subsidy. What are the values of the intercept terms a, b and c in the graph?
c. How much of each good does the household consume at bundle A- i.e. what are the values of d and e in the graph. How much would the household consume of each good after the subsidy?
d. Answer this part in terms of letters on the vertical axis of the graph. What is the most this household would be willing to pay in cash to get this price subsidy? If a household already had the subsidy (without having paid any cash to get it), what is the least that we would have to pay the household in cash for the household to be willing to give up the subsidy?
e. The expenditure function for this household is approximately E(p,u)=1.755p0.25u. Calculate dollar values for the first question in part (d).
f. What is the dollar value for the second question in part (d)?
g. If the subsidy is put in place (without the household making any cash payments to get it), how much will the subsidy cost the government? Express this as a distance in the graph as well as a dollar value.
h. Explain intuitively why there is a deadweight loss of implementing the subsidy - and then calculate the dollar value of the deadweight loss.
i. Calculate the bundles C and D in the graph - i.e. calculate the values for f, g, h and i. (Hint: You can do this a number of different ways - but the quickest way would be to use your answers to parts (e) and (f).)
What will be an ideal response?
Using the data in the above table, gross private domestic investment equals
A) $250. B) $260. C) $460. D) some amount that cannot be determined without more information.
Refer to the above figures. If a positive externality that existed becomes corrected, price and quantity will become
A) P1 and Q1. B) P2 and Q2. C) P3 and Q3. D) P4 and Q4.