A contour map illustrates which of the following?
A. The cause–effect relationship between two variables
B. The cause–effect relationship between three variables
C. The way that three variables are correlated
D. The way that one variable affects another, which in turn affects a third variable
E. The way that two variables are correlated and in turn cause changes in a third variable
Answer: C
You might also like to view...
The economy's long-run aggregate supply curve
a. never shifts b. indicates that in the long run, the price level is constant c. is shifted by demand shocks d. is a vertical line at the full-employment level of output e. is perfectly elastic
Distinguish between the money and non-money costs parents face when raising a child. Money costs might include ______, whereas non-money costs might include ______.
a. center-based child care fees; hiring a babysitter at home b. redecorating the child’s room; making mortgage payments c. playing yard games with the child; buying sports equipment d. tuition for music lessons; volunteering in the child’s classroom
When the interest rate on newly issued bonds increases, the price of existing bonds:
A. decreases. B. may either increase or decrease. C. increases. D. increases only if the coupon rate is below the new rate.
Refer to the information provided in Figure 2.4 below to answer the question(s) that follow.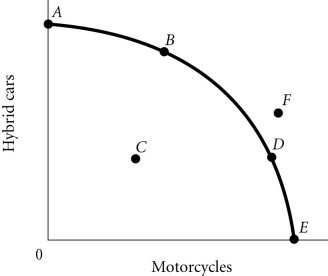 Figure 2.4According to Figure 2.4, as the economy moves from Point B to Point D, the opportunity cost of motorcycles, measured in terms of hybrid cars,
A. increases B. remains constant. C. initially increases, then decreases. D. decreases.